The city of St. John’s has changed a great deal over the past decade. The influx of oil money has filled people’s pockets as it did, for a time, the provincial Treasury. The moratorium on the Northern Cod fishery in July of 1992 put 30,000 people immediately out of work and set the province’s population in decline for the next ten years. But by 1997 Hibernia, the first of the offshore oilfields to be developed, was producing oil and by 2005 the Terra Nova and White Rose fields had joined it. The development of these fields and the subsequent extraction of oil brought to a province laden with persistently high unemployment the prospect of ready jobs and rising wages. As the largest community in the province and the nearest to the North Atlantic oilfields, St. John’s felt the effects of this boom acutely. In the past decade, the cost of almost everything has risen and in nothing has this rise been more precipitous than the cost of housing. The purpose of this page is to explore the effects of the recent economic boom on housing prices in the city and to investigate how it has affected different parts of the city differently, comparing its effects on a working-class neighbourhood to its effects on the object of our study in this course, Churchill Park.
The heating of the provincial economy was most pronounced in the years from 2005-2011, as the median income in the province rose 43% and the average value of a house in the city approximately doubled(1). But to call this economic surge an ‘oil boom’ would be misleading. Certainly, some residents of the province were employed to construct the platforms needed to extract the oil from beneath the seabed and some are now employed operating, maintaining, and servicing these platforms. This economic activity, however, had been occurring since the mid-eighties and production had been underway on the largest of the three oilfields, Hibernia, since 1997.
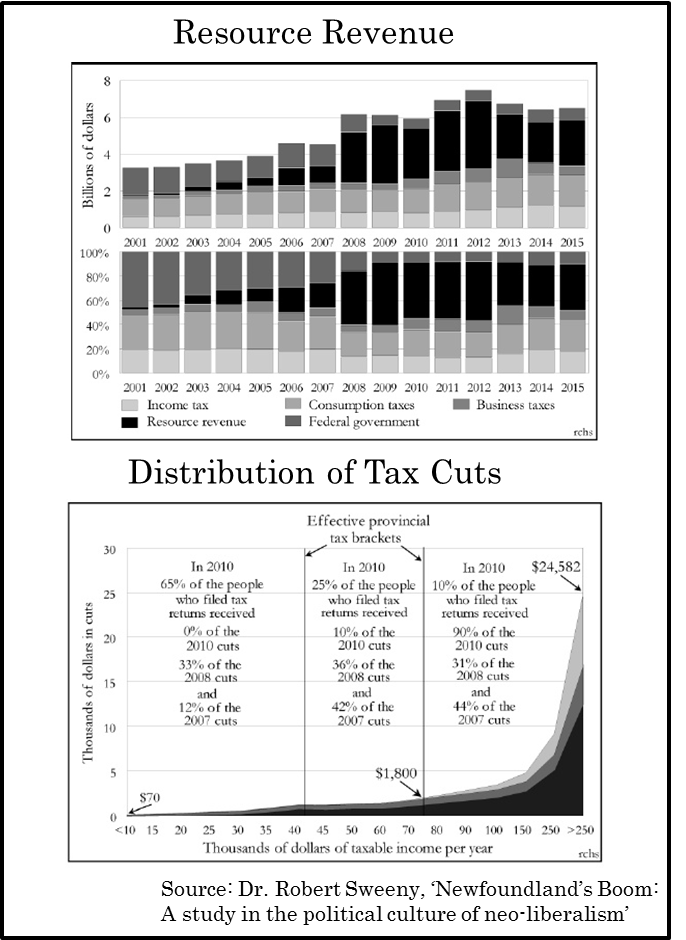
Resource royalties (black) as a share of provincial revenue; distribution of Williams-era tax cuts, from low-income earners (left) to high-income earners (right).
The boom was certainly in part caused by resource extraction projects and their derivative economic effects, but these were not the only causes. What changed in the years following 2005 were two things: first, the royalty structure agreed between the province and the oil firms had reached a phase more favourable to the province, and second, three sets of changes to the provincial tax code had substantially decreased the tax burden on a portion of taxpayers. Oil prices were high with no expectation of falling and, as the private investment in Hibernia had been recouped, full royalties from the project were inundating the province’s coffers. By 2008, resource royalties comprised two-fifths of provincial revenue. With the new wealth, the Williams government expanded the public service, raised the wages of public employees, and invested in widespread and large-scale infrastructure development. As the government itself, not any oil company, was and still is the largest employer in the province, this eclipsed any growth in the resource sector. Along with this royalty-backed public spending, a series of three tax cuts were implemented by the Progressive Conservative government, which largely reduced the tax burden of the middle and upper classes.

Cost of housing in the city, from 2001 to 2011.
The effects of this economically- and politically-prompted boom are seen clearly today. Housing prices in the city, which once were some of the lowest urban housing prices in the country, have dramatically increased. The average value of a dwelling in St. John’s in 2001 was $114,086. By 2006, this had measure had risen to $164,374. By 2011, as the boom years were ending, the average value of a house in the city was $285,415, an astronomic and unprecedented doubling of the figure of only ten years before(2). New houses, which throughout the first years of the new millennium had never cost more than 5.6% more than those built the year before, by 2008 cost 19.6% more than those built in 2007. And in 2009 the average new house cost yet 11.7% more than did those built in 2008(3). This could have been expected. Jobs became available and wages rose far quicker than houses could be built. More residents with more money competed for largely the same stock of housing. These conditions, until sufficient buildings can be repurposed or built, are bound to lead to bidding wars, higher asking prices, and landlords who can either eke an extra hundred dollars per month from their tenants or easily find new ones. Moreover, a high asking price on a sign in front of your neighbour’s house, when the property assessor comes round, will only lead to the value your own home being increased, even though if both properties were put up for sale at the same time it is unlikely either would sell for such a price.

Incomes in Churchill Park, from 2006 to 2011.
In Churchill Park, the average value of a house increased 43.3% between the years 2006 and 2011. Houses in this neighbourhood had since its development in the 1940s and 50s cost substantially more than houses in other parts of the city. The homes built by the St. John’s Housing Corporation were as of 1943 supposed to be priced between $2,500 and $3,500, an attainable sum at the time for the middle-class household eager to escape the urban congestion of downtown St. John’s, but after cost overruns were accounted for the final price of these homes averaged $11,300(4). As such, homes in Churchill Park were attainable only by those with significantly higher than average incomes. The average value of a house in Churchill Park in 2006 was an already-hefty $292,170, but by 2011 this had risen to $418,731. Median household income in this neighbourhood over these same years decreased by 10.8%, from $86,985 to $77,602, but after-tax income increased 1.3%, from $67,986 to $68,898. Certainly, the boom’s impact on housing prices affected Churchill Park, but the supposed buoyancy of incomes during boom-times seems not to have obtained.

Incomes in Rabbittown, from 2006 to 2011.
In Rabbittown, roughly an extended diamond with its Western extreme the Shopper’s at the corner of Freshwater Road and Empire Avenue and its Eastern extreme the Sobeys at the corner of Merrymeeting and Newtown Roads, the boom years told a different tale. The average value of a house in this neighbourhood rose 78.1% over the same years, with a house in 2006 costing, on average, $113,630 and a house in 2011 costing, on average, $202,346. In an area of dense low-income housing, with many homes visibly deteriorating and in need of repair, this increase is remarkable. With the boom years, for Rabbittown at least, came a rise in employment and a rise in income, too, both before- and after-tax. The median household income in 2006 was $33,165 and by 2011 it had increased to $39,970. After-tax, this rise remained. In 2006, the after-tax figure was $30,135, which by 2011 had risen to $37,783. This represents a 20.5% increase in median household income before-tax and a 25.4% increase after-tax.
The economic boom of 2005-2011 affected these two neighbourhoods differently. Churchill Park, an affluent suburb, saw a marked increase in the dollar-value of homes and a modest decrease in before-tax incomes but a small increase in after-tax incomes. Rabbittown, an urban borough populated largely by the working poor, saw a near-doubling in the average value of a home and a comfortable increase in median before- and after-tax household incomes. A number of factors explain how the years 2005-2011 treated these neighbourhoods differently. First, each would have been affected by different stages of the economic boom. Churchill Park is a largely professional and executive neighbourhood. It was unlikely to have benefited from the available jobs in construction, resource extraction, or in supply and service to these two industries. Neither was it likely the expansion of the public service or the higher salaries of public-sector employees would have much affected this neighbourhood. Here, one would not expect incomes to rise. If Churchill Park benefited from the ‘oil’ boom at all it was probably at a much earlier point, when oil executives were moving into the city and their companies were purchasing and heavily renovating already-expensive houses for them, increasing the value of surrounding homes for their owners. Rabbittown, on the other hand, would have benefited largely from the readily-available jobs in both extraction and construction, and in places like convenience stores and other low-wage employers which always derive more business from people having more money to spend. More people were employed and the median income for this neighbourhood accordingly increased.
Second, the actions taken by the Williams government affected each neighbourhood in subtly but noticeably different ways. Churchill Park’s many high-income earners found themselves taxed at a continually lower rate, as the initial graph shows, and consequently saw an increase in their after-tax income despite the 10.8% decrease in their before-tax earnings. Rabbittown, however, saw its low-income earners earn a little more. Between the 2006 and 2011 censuses, the provincial government increased minimum wage, gradually, to $10.50/hour from $6.00/hour in 2005. As the median household income in Rabbittown in both 2006 and 2011 was between $30,000 and $40,000, it is not difficult to imagine a fair number of earners in these households were working for the minimum wage. Along with the higher number of residents employed, this modest increase in earnings at the minimum wage explains how median household income in this neighbourhood saw its over twenty-percent increase.

Cost of housing v. after-tax income, from 2006-2011: Churchill Park & Rabbittown.
Lastly, though the housing costs in both neighbourhoods rose, as we can see from the final graphs this rise was both more substantial in Rabbittown, and its residents, unlike those in Churchill Park, were less likely to benefit at all from it. As is represented by the slope of the red lines in the adjacent graphs, the increase in the average value of a home in Rabbittown from 2006-2011 was almost double that of Churchill Park. While Rabbittown’s increase was a little above the city average, Churchill Park’s was considerably below. Though after-tax median household income in Rabbittown rose by a quarter over these 5 years while the same measure rose just over one-percent in Churchill Park, as is represented by the slope of the blue lines, this does not equate with a comparable ability to pay for the rapidly-rising cost of shelter. First, those making minimum-wage or a little more in Rabbittown spend a much larger portion of their income on shelter than do those making more than double that in Churchill Park. When this is matched with a 78.1% increase in housing cost, compared to a 43.3% increase, the discrepancy is only aggravated. Second, most residents of Rabbittown rent, whereas far more residents of Churchill Park own their own homes. A rise in the value of neighbourhood homes for one who rents their home means that one’s rent is likely to increase; a rise in the value of neighbourhood homes for one who owns their home means that one’s net worth is likely to increase. The high-income earners in Churchill Park may not have much benefited from the resource-driven economic expansion 2005-2011, beyond an increase in the value of their assets and a decrease in their rate of taxation, but, unlike the low-income earners of Rabbittown, they have little to fear of the impending contraction.
—Jim Doyle & Hayward Sheppard
(1) Sweeny, Robert C.H. 2015. “Newfoundland’s Boom: A study in the political culture of neo-liberalism.” Accessed November 19, 2015. https://www.academia.edu/9698133/Newfoundland_s_Boom_A_study_in_the_political_culture_of_neo-liberalism
For forty-three percent rise in median income figure and all other references to 2005-2011 boom years, especially in the subsequent paragraph, see Sweeny.
(2) Statistics Canada. CMA and Census Tract data for years 2001, 2006, and 2011. Accessed November 23, 2015. http://www12.statcan.gc.ca/census-recensement/index-eng.cfm
For all ‘Churchill Park’ and ‘Rabbittown’ data from the years 2006 and 2011, see StatsCan.
(3) Canada Mortgage and Housing Corporation. 2015. “Housing Market Indicators, St. John’s (1990-2014).” Canadian Housing Observer. Accessed via D2L.
(4) Lewis, J. & Shrimpton, M. 1982. “Policymaking in Newfoundland in the 1940s: The Case of the St. John’s Housing Corporation.” Centre for Newfoundland Studies. Accessed via D2L.
