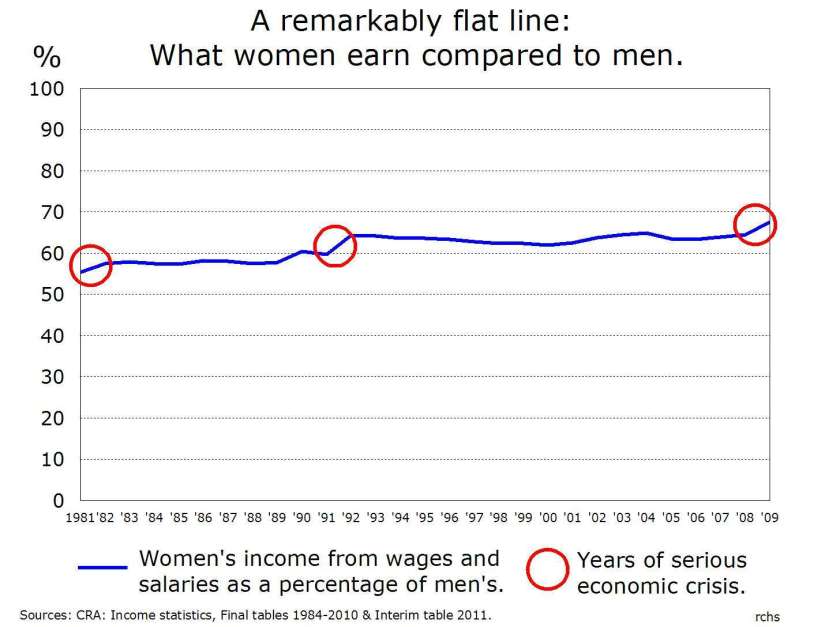
Women became half of the paid workforce in Canada for the first time in 2009. Already by 2007, 60% of the people graduating from our universities were women, while many women were working in occupations that only a generation ago were overwhelmingly, if not exclusively, male preserves.
As important as they are, these fundamental changes have yet to result in any significant reduction in the gap between what women and men earn in Canada.
What is it that we are seeing?
The pattern is simple enough: a short spurt in 1981, followed by stability through to the late 1980s, some movement up to the early 1990s, and then an almost two-decade-long period of stagnation, until a jump in 2009.
Is this too simple? Is it meaningful to take the average income from wages and salaries for women and compare it to that of men? Are there not differences related to work experience and training that would explain the gap?
In 2001, Statistics Canada released the most detailed study yet compiled of what it called the Persistent Gap. Based on a 1997 survey of 28,000 Canadians, after controlling for age, education, seniority and a number of other variables, the study found the gap to be on average 63.8¢ on the dollar. The graph shows it to be 62.8¢.
If the calculations based on the final tables, 1981-2008, are a good approximation, the same cannot be said for 2009. This figure comes from the interim tables, which systematically underestimate male income, so the only major improvement in almost 20 years may not be as important as the graph suggests.
The long struggle for equity
For more than a century, feminists have campaigned for equal pay for work of equal value. It was the principal recommendation of the 1984 Abella Commission on equity in employment. Across the country, labour unions joined with feminist organizations in the 1980s and 1990s to pressure both the federal and provincial governments to adopt enabling legislation.
It was not an easy process. In the mid-1990s, the Harris and Flaherty Conservatives in Ontario axed the NDP equity law. While in our own province, Clyde Wells’ Liberals suspended the legislation for budgetary reasons.
Nevertheless, throughout the land we now have laws, policies and regulations to promote equity in the workplace and ban discriminatory practices. So, why has there been so little improvement in wages and salaries?
What is the nature of the problem we face?
The remarkable stability in the relationship is itself important, for it strongly suggests that this is not really an economic question. A flat line over four full business cycles indicates that the lack of progress is due more to social, cultural and attitudinal problems than purely economic ones.
Indeed, a closer examination of the years that saw the greatest changes confirms this analysis. The biggest changes occurred during years of economic crisis: the Reagonomics-inspired supply-side recession of 1981; the “it’s the economy, stupid” recession of 1991-2; and the global crisis of 2008-09.
All three crises saw highly gendered mass lay-offs that affected men far more than women, while in 1992 and 2009 men’s wages actually declined, by 2.5% and 5.9% respectively. But clearly, if it takes massive economic downturns for the inherently cyclical nature of our economy to be even visible on the graph, then we are indeed dealing with deeply rooted and probably largely non-economic forms of resistance to gender equity.
What does this say about the future?
If we fail to address these fundamental problems, then this suggests two possible scenarios. The first, based on the whole period, including the recession years of 1981 and 2009, would see parity being achieved by 2087, primarily through numerous crises driving down men’s wages. With the second scenario, based on the pattern of limited progress from 1982 through to 2008, we won’t see wage parity being achieved until 2147.
