
Figure 1 Population of Newfoundland and Labrador by 20 year age groups, 2011.
According to the Newfoundland and Labrador Statistics Agency, as of 2011 the population of Newfoundland and Labrador can be broken down as follows: 20% under 20 years of age, 25% between 20 and 39 years of age, 32% between the ages of 40 and 59, 19% between the ages of 60 and 79, and 4% over the age of 80, with a mean age of 42.
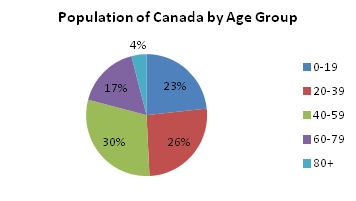
Figure 2: Population of Canada by 20-year age group, 2011
The population of Canada as a whole, by comparison, is slightly younger, with a larger portion of the population being under 40 years of age than in Newfoundland and Labrador, and, in turn, a significantly smaller portion of the population being over 40, as well as a mean age of 40. This disparity is likely to be the result of high rates of outmigration in the province among the working-age population.
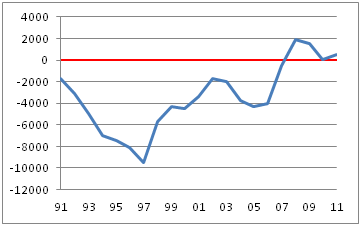
Figure 3: in-/out-migration in Newfoundland and Labrador between 1991-2011
In 1991, the outmigration rate of Newfoundland and Labrador was approximately 2,000 per year. This rate, affected by the Moratorium of 1992, increased steadily over the next six years before peaking at nearly 10,000 per year in 1997. Although outmigration has since stabilised around a net 0, the 15 years of heavy outmigration (with the vast majority of emigrants being between the ages of 15 and 30) saw Newfoundland and Labrador stripped of a huge portion of its young working population, who would have contributed to the economy, as well as parented the next generation of children in Newfoundland and Labrador.
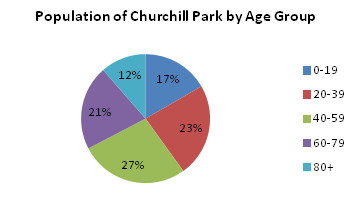
Figure 4: Population of the Churchill Park area by 20-year age group, 2011
The population of the Churchill Park area is even older than that of Newfoundland and Labrador as a whole, with 60% of the population in the area being over the age of 40, an over-60 portion three times larger than that of the provincial population, and a mean age of 47, which is seven years older than the national average. The presence of apartment complexes in the area is likely to be a factor here, as apartments are more affordable than houses with mortgages and thus more reasonable for many retirees.

Figure 5: Population of Newfoundland and Labrador by age group in 2001, 2006, and 2011
Looking at the age demographics of Newfoundland and Labrador in 2001, 2006, and 2011 reveals a rather dramatic decline in the portion of the under-40 age group, coupled with a significant increase of the older population. This is, once again, likely a result of outmigration of the young population in search of employment, which would also lead to a decrease in birth rates.
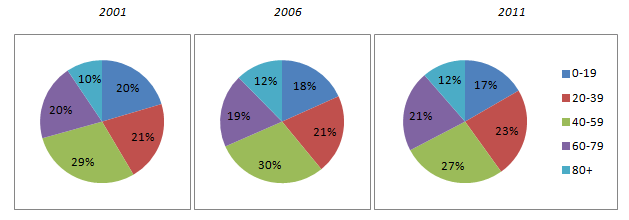
Figure 6: Population of the Churchill Park area by age group in 2001, 2006, and 2011
The age demography of the Churchill Park area, by comparison, is actually much more stable than that of Newfoundland and Labrador as a whole, with demographic changes similar to those in the rest of the province occurring, but much less pronounced. This is likely due to the area’s status as a middle-to-upper-class neighbourhood, which would isolate it from the low-income job losses of the prior decades, as well as the presence of apartment complexes in the area, which would attract an older population regardless of the demographic changes occurring in the rest of the city and province.
References
Community Accounts: Population by Age Group
