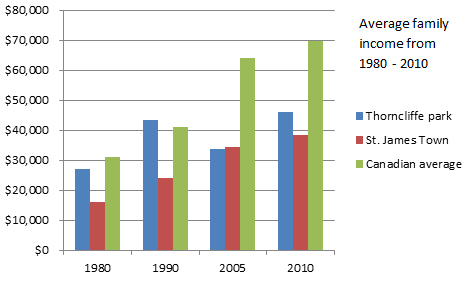
Average income for Thorncliffe Park and St. James Town from 1979 – 2010
In this section we examine average income for all families resident in Thorncliffe Park and St. James Town, and the ethnic changing of both neighborhoods. Looking at Thorncliffe Park in this graph it can be seen that the average income of all residents has for the most part grown since 1981 from around $28,000 to $40,000 in 1991. However, it is important to note that after 1991 the census tract was divided into four parts effectively separating the area of low income housing from the middle class area. The result is that in by 2005 when income data is observed again it had declined from its 1991 levels. Over this 30 year period, Canadians generally saw sustained growth in their average incomes, but gains in Thorncliffe Park were consistently lower (as seen left).
In St. James Town the income has progressively improved for the period between 1979 – 2010. This positive trend however is troubling. In 1979 the difference between the average income of the area and the Canadian average was $15,168 and this gap has slowly increased in that same thirty year period. In 1991 the difference in incomes was $17,023, in 2005 $29,431, and in 2010 the difference was $31,135. So while it is true that on average the incomes that people make in St. James town are growing, they are actually falling further behind the rest of the country.
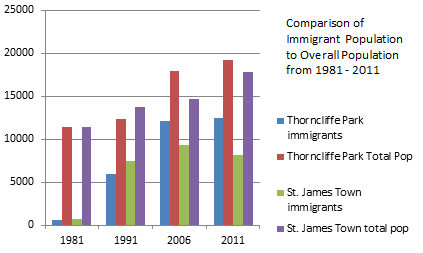
Comparing census data on total population to immigrant population from 1981 – 2011
Figure (seen right) explores immigrant numbers in the areas of St. James town and Thorncliffe Park. You can clearly see that the numbers of immigrants have steadily increased in both the St. James Town and Thorncliffe Park area over the thirty year period from 1980 – 2011. The increase in the 1980 – 1992 data is attributed to the changing of Canadian immigration laws and policy. In Thorncliffe Park the number of immigrants has risen steadily since 1992 from 5925 to 12455 people in 2011. This equates to an increase from 48% of the population in 1992 to 64% in 2011. The more Prominent ethnic make ups of the city are East Indian, Pakistani, and Filipino[1]. Not only has the immigrant population increased but the number of people living in the area has as well. However in the last 5 years immigration numbers and total population numbers have leveled off with no explanation. As explained in the profile for Thorncliffe Park many residents believe the number of people living in the area to be around 33,000 people as of 2011[2].
In St. James Town the situation is a bit different; their immigrant population has grown from 7475 people in 1992 to 8175 in 2011. This is actually a decline from 2006 when the immigration population was 9285. Their Ethnic makeup is also somewhat different consisting of mainly Filipino, English, East Indian and Chinese immigrants[3]. This decline also has no explanation however it could be due to two different factors. The lack of action on the public works projects for the community and the disregard for building maintenance, and the increase of immigrant to other areas of the city like the peel region which was an 80 % increase from 2001 – 2006. As of 2011 the immigrant population makes up approximately 45% of the total population of the area.
*Notes: The data on this page was acquired from Statistics Canada and the National Household Survey.
Conclusion
For both St. James Town and Thorncliffe Park a combination of low income earning, high poverty rates, high unemployment rates, increasing populations, challenges of health and language, and a high density of people per square kilometer all factor into the inequality that immigrants face when they move into these areas. These factors are contributing to the many challenges and are part of the inequalities that immigrants will face upon arrival in these areas. In the case of Thorncliffe Park the community has been able to come together to help support one another and make it easier to adjust to life in Canada. In St. James Town the city is looking at changes to try and ease the challenges but no real changes have happened yet. It is not guaranteed that building a stronger community in St. James Town will erase signs of inequality. As Saunders states Thorncliffe park is not a perfect place[4], it has serious problems many of which are similar in St. James Town, but it should make the community stronger and empower them to push for changes.
[1] “Thorncliffe Park Neighbourhood Census NHS Profile.” Statistics Canada (2011), http://www1.toronto.ca/City%20Of%20Toronto/Social%20Development,%20Finance%20&%20Administration/Neighbourhood%20Profiles/pdf/2011/pdf4/cpa55.pdf
[2] Justin Giarritta, T. Michael Liles, Rachel Ortega, Lisa González, Edson Veizaga, “The Arrival City A Case Study of Thorncliffe Park.” In Urban Action 2011, ed. Tyler Evje, Nikolara Jansons, (San Fransisco State University), 59. http://dusp.sfsu.edu/sites/sites7.sfsu.edu.dusp/files/UrbanAction_2011.pdf#page=
[3] “North St. James Town Neighbourhood Census NHS Profile.” Statistics Canada (2011). http://www1.toronto.ca/City%20Of%20Toronto/Social%20Development,%20Finance%20&%20Administration/Neighbourhood%20Profiles/pdf/2011/pdf4/cpa74.pdf
[4] Dylan C. Robertson, “Examining Toronto’s Arrival Cities.” The Varsity University of Toronto (Novermber 15, 2010). http://thevarsity.ca/2010/11/15/examining-torontos-arrival-cities/
*Canadian Census 1980 – 1992
Statistics Canada. No Date. Canadian Census Analyser. Using CHASS (University of Toronto). http://datacenter.chass.utoronto.ca/census/ct.html
*Canadian Census 2006
The 2006 Canadian census can be found at here.
*Canadian Census 2011
The 2011 Canadian census can be found here.
